Categorical & Categorical - Exercise
- Open "Orange".
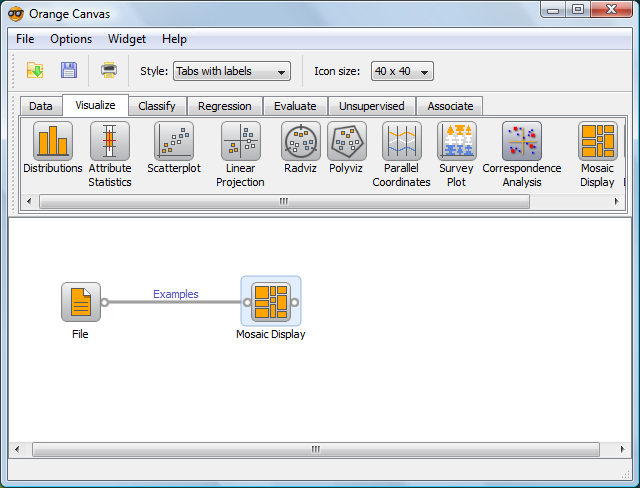
- Drag and drop "File" widget and double click to load a dataset (contact_lenses.txt).
- Drag and drop "Mosaic Display" widget and connect it to the "File" widget.
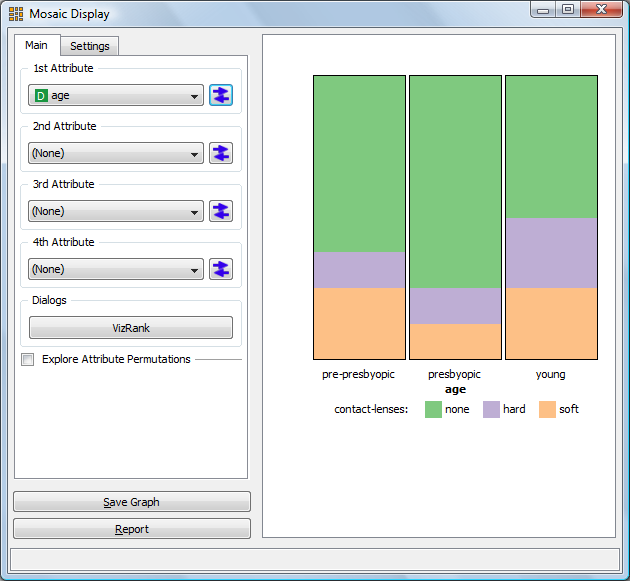
- Double-click on the "Mosaic Display" to see the plot.