| Map
> Data Science > Predicting the Future >
Modeling >
Classification > Linear Discriminant Analysis |
|
|
|
|
|
|
Linear
Discriminant Analysis
|
|
|
| Linear Discriminant Analysis (LDA) is a classification method originally developed in 1936 by
R. A. Fisher. It is simple, mathematically robust and often produces models whose accuracy is as good as more complex methods. |
|
|
| |
|
|
| Algorithm |
|
|
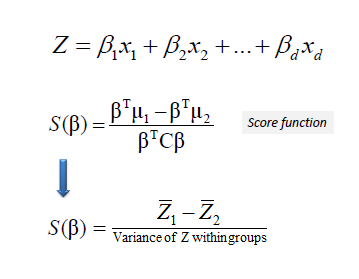
| LDA is based upon the concept of searching for a linear combination of variables
(predictors) that best separates two classes (targets).
To capture the notion of separability, Fisher defined the following score
function. |
|
|
|
|
|
|
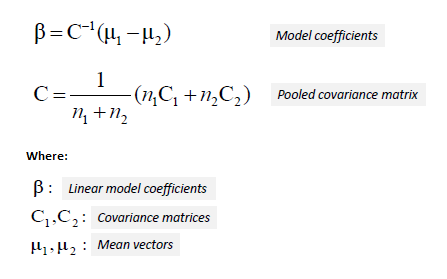
| Given the score function, the problem is to
estimate the linear coefficients that maximize the score which can be solved
by the following equations. |
|
|
|
|
|
|
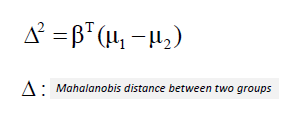
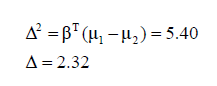
| One way of assessing the effectiveness of the discrimination is to calculate the
Mahalanobis distance between two groups. A distance greater than 3 means that in two
averages differ by more than 3 standard deviations. It means that the overlap (probability of misclassification) is quite small. |
|
|
|
|
|
|
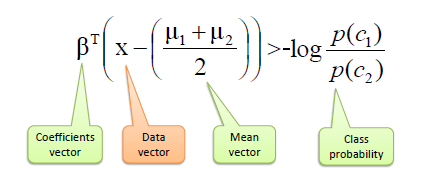
| Finally, a new point is classified by projecting it onto the maximally separating
direction and classifying it as C1 if: |
|
|
|
|
|
|
| |
|
|
| Example: |
|
|
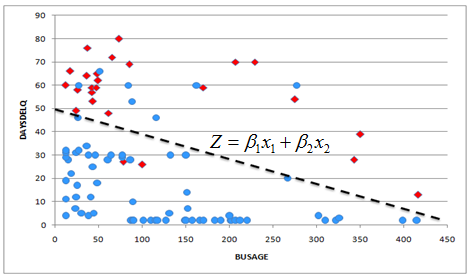
| Suppose we received a dataset
from a bank regarding its small business clients who defaulted (red square) and those that did not (blue circle) separated by delinquent days (DAYSDELQ) and number of months in business
(BUSAGE). We use LDA to find an
optimal linear model that best separates two classes (default and
non-default). |
|
|
| |
|
|
|
|
|
|
| |
|
|
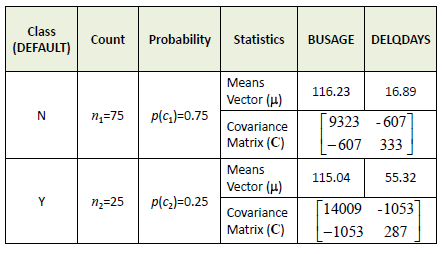
| The first step is to calculate the mean
(average) vectors,
covariance matrices and class probabilities. |
|
|
|
|
|
|
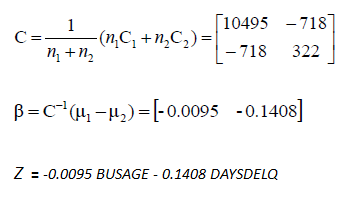
| Then, we calculate pooled covariance
matrix and finally the coefficients of the linear model. |
|
|
|
|
|
|
| A Mahalanobis distance of 2.32
shows a small overlap between two groups which means a good separation
between classes by the linear model. |
|
|
|
|
|
|
|
|
|
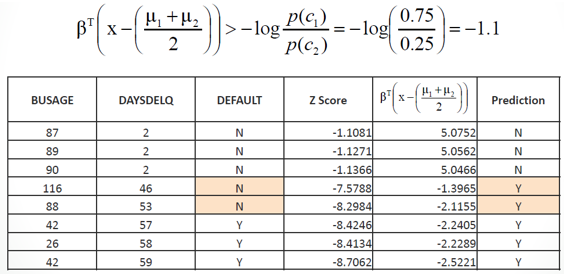
| In the following table, we calculate Z
score using the above Z equation. However, a score by itself cannot be
used for predicting an outcome. We also need the equation in column 5 to
choose Class N or Y. We predict Class N if the calculated value is bigger
than -1.1 otherwise Class Y. As it is shown below, the LDA model made two
errors. |
|
|
|
|
|
|
|
|
|
| |
|
|
| Predictors Contribution |
|
|
| A simple linear correlation between the
model scores and predictors can be used to
test which predictors contribute significantly to the discriminant function.
Correlation varies from -1 to 1, with -1 and 1 meaning the highest
contribution but in different directions and 0 means no contribution at
all. |
|
|
|
|
|
| |
|
|
Quadratic Discriminant Analysis (QDA)
|
|
|
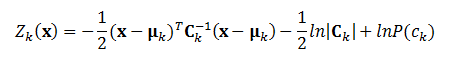
| QDA is a general discriminant function
with a quadratic decision boundaries which can be used to classify
datasets with two or more classes. QDA has more predictability power than
LDA but it needs to estimate the covariance matrix for each classes. |
|
|
|
|
|
|
| where Ck is
the covariance matrix for the class k
(-1 means inverse matrix), |Ck|
is the determinant of the covariance matrix Ck,
and P(ck) is the
prior probability of the class k. The
classification rule is simply to find the class with highest Z
value. |
|
|
|
|
|
| |
|
|
|
|
|
|
| |
|
|
 Try to invent a real time LDA classifier. You should
be able to add or remove data and variables (predictors and classes) on
the fly.
Try to invent a real time LDA classifier. You should
be able to add or remove data and variables (predictors and classes) on
the fly. |
|
|
| |
|
|
|
|
|
|
|
|
