| Map
> Data Science > Predicting the Future >
Modeling >
Classification > Logistic Regression |
|
|
|
|
|
|
Logistic
Regression
|
|
|
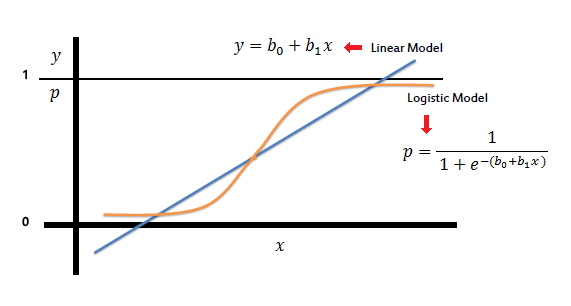
| Logistic regression predicts the probability of an
outcome that can only have two values (i.e. a dichotomy). The prediction is based on the use of one or several predictors
(numerical and categorical). A linear regression is not appropriate for predicting the value of a binary variable for two reasons: |
|
|
|
|
|
- A linear regression will predict values outside
the acceptable range (e.g. predicting probabilities
outside the range 0 to 1)
- Since the dichotomous experiments can only have
one of two possible values for each experiment, the residuals will not
be normally distributed about the predicted line.
|
|
|
| On the other hand, a logistic regression produces a logistic
curve, which is limited to values between 0 and 1. Logistic regression is
similar to a linear regression, but the curve is constructed using the
natural logarithm of the “odds” of the target variable, rather than
the probability. Moreover, the predictors do not have to be normally
distributed or have equal variance in each group. |
|
|
|
|
|
|
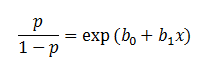
| In the logistic regression the constant (b0)
moves the curve left and right and the slope (b1)
defines the steepness of the curve. By simple transformation, the logistic regression equation can be written in terms of an odds ratio. |
|
|
|
|
|
|
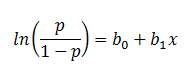
| Finally, taking the natural log of both sides, we can write the equation in terms of
log-odds (logit) which is a linear function of the predictors. The coefficient (b1)
is the amount the logit (log-odds) changes with a one unit change in x. |
|
|
|
|
|
|
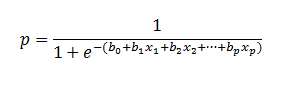
| As mentioned before, logistic
regression can handle any number of numerical and/or categorical variables. |
|
|
|
|
|
|
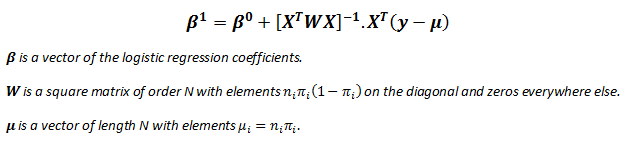
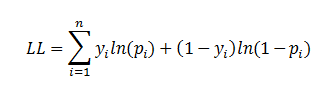
| There are several analogies between linear regression and logistic regression. Just as
ordinary least square regression is the method used to estimate coefficients for the best fit line in linear regression, logistic regression
uses maximum likelihood estimation (MLE) to obtain the model coefficients that relate
predictors to the target. After this initial function is estimated, the process is repeated until LL (Log Likelihood) does not change significantly. |
|
|
| |
|
|
|
|
|
|
| |
|
|
| A pseudo R2 value is also available to indicate
the adequacy of the regression model. Likelihood ratio test is a test of the significance of the difference between the likelihood ratio for the baseline model minus the likelihood ratio for a reduced model.
This difference is called "model chi-square“. Wald test
is used to test the statistical significance of each coefficient (b) in the
model (i.e., predictors contribution).
|
|
|
| |
|
|
| Pseudo R2
|
|
|
| There are several measures intended to mimic the R2
analysis to evaluate the goodness-of-fit of logistic
models, but they cannot be interpreted as one would interpret an
R2 and different pseudo R2 can arrive at very different values.
Here we discuss three pseudo R2measures. |
|
|
| |
|
|
|
Pseudo R2 |
Equation |
Description |
|
Efron's |
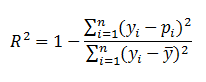 |
'p' is the
logistic model predicted probability. The model residuals are squared, summed, and divided by the total variability in the dependent variable. |
|
McFadden's |
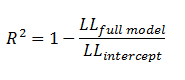 |
The ratio of the log-likelihoods suggests the level of improvement over the intercept model offered by the full model. |
|
Count |
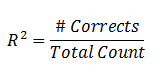 |
The number of records correctly predicted, given
a cutoff point of .5 divided by the total count of cases. This is
equal to the accuracy of a
classification model. |
|
|
|
| |
|
|
| Likelihood Ratio Test |
|
|
| The likelihood ratio test provides the means for comparing the likelihood of the data under one
model (e.g., full model) against the likelihood of the data under another, more restricted
model (e.g., intercept model).
|
|
|
 |
|
|
|
where 'p'
is the logistic model predicted probability. The next step is to calculate the difference between these two
log-likelihoods. |
|
|
|
|
|
|
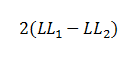
| The difference between two likelihoods is multiplied by a factor of 2
in order to be assessed for statistical significance using standard significance
levels (Chi2 test). The degrees of freedom for the test will
equal the difference in the number of parameters being estimated under the
models (e.g., full and intercept). |
|
|
| |
|
|
| Wald test |
|
|
| A Wald test is used to evaluate the statistical significance of each coefficient
(b) in the model. |
|
|
|
|
|
|
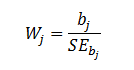
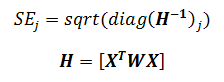
| where W
is the Wald's statistic with a normal distribution (like Z-test), b is
the coefficient and SE is its standard
error. The W value is then squared, yielding a Wald statistic with a chi-square distribution. |
|
|
| |
|
|
|
|
|
|
| |
|
|
| Predictors Contributions |
|
|
| The Wald test is usually used to assess the significance of prediction of each predictor.
Another indicator of contribution of a predictor is exp(b)
or odds-ratio of coefficient which is the amount the logit (log-odds) changes, with a one unit change in
the predictor (x). |
|
|
| |
|
|
|
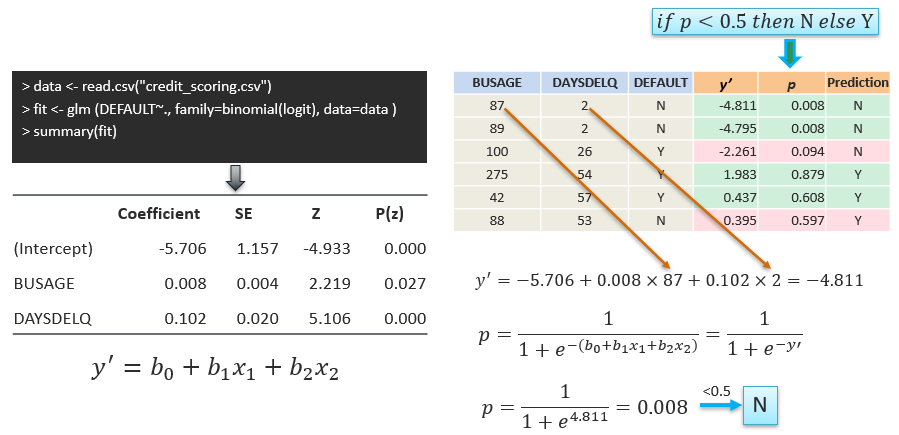
Example using R |
|
|
|
|
|
|
| |
|
|
| |
|
|
| Interpretation of Coefficients |
|
|
| Increasing BUSAGE by 1 month (and
keeping all other variables fixed) multiplies the estimated odds of DEFAULT
by exp(0.008) ≈ 1.008, or in other words, increases the odds by 0.8%. |
|
|
| Increasing DAYSDELQ by 1 day (and
keeping all other variables fixed) multiplies the estimated odds of DEFAULT
by exp(0.102) ≈ 1.07, or in other words, increases the odds by 7%. |
|
|
| |
|
|
|
|
|
|
| |
|
|
|
|
|
|
|
|
