| Map
> Data Science > Predicting the Future >
Modeling > Regression
> Multiple Linear Regression |
|
|
|
|
|
|
Multiple Linear
Regression
|
|
|
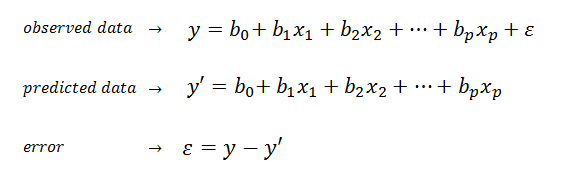
| Multiple linear regression (MLR) is a method used to model the linear relationship between a
dependent variable (target) and one or more independent variables
(predictors). |
|
|
|
|
|
|
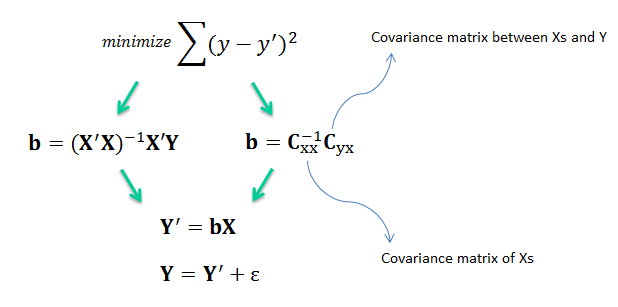
| MLR is based on ordinary least squares (OLS), the model is fit such that the sum-of-squares of differences of observed and predicted
values is minimized. |
|
|
|
|
|
|
| The MLR model is based on several
assumptions (e.g., errors are normally distributed with zero mean and constant variance). Provided the assumptions are satisfied, the regression
estimators are optimal in the sense that they are unbiased, efficient, and
consistent. Unbiased means that the expected value of the estimator
is equal to the true value of the parameter. Efficient means that the estimator has a smaller variance than any
other estimator. Consistent means that the bias and variance of the estimator approach zero as the sample size
approaches infinity. |
|
|
|
|
|
| How good is the model? |
|
|
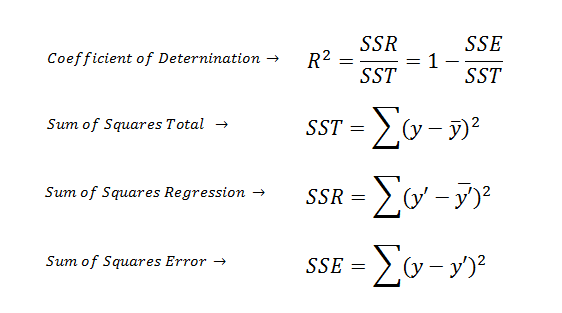
| R2 also called as coefficient
of determination summarizes the explanatory power of the regression
model and is computed from the sums-of-squares terms. |
|
|
|
|
|
|
| R2 describes the proportion of variance
of the dependent variable explained by the regression model. If the regression
model is “perfect”, SSE is zero, and R2 is 1. If the regression
model is a total failure, SSE is equal to SST, no variance is explained by regression, and
R2 is zero. It is important to keep in mind that there is no
direct relationship between high R2 and causation. |
|
|
| |
|
|
| How significant is the model? |
|
|
| F-ratio estimates the
statistical significance of the regression model and is computed from the
mean squared terms in the ANOVA table. The significance of the F-ratio is obtained by referring to
the F distribution table using two degrees of freedom (dfMSR,
dfMSE). p
is the number of independent variables (e.g., p
is one for the simple linear regression). |
|
|
|

|
|
|
| The advantage of the F-ratio over R2 is that
the F-ratio incorporates sample size and number of predictors in assessment of significance of the
regression model. A model can have a high R2 and still not be statistically significant. |
|
|
| |
|
|
| How significant are the
coefficients? |
|
|
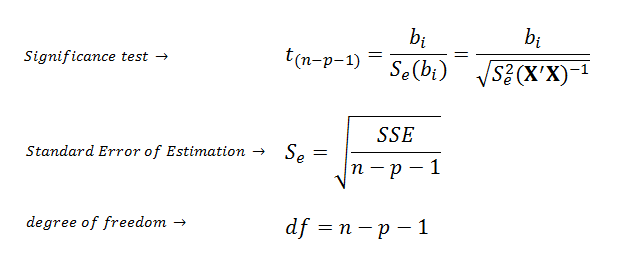
| If the regression model is
significantly good, we can use t-test to estimate the statistical
significance of each coefficient. |
|
|
|
|
|
|
| Example |
|
|
| |
|
|
| Multicolinearity |
|
|
| A high degree of multicolinearity
between predictors produces unreliable regression coefficient estimates. Signs of multicolinearity include: |
|
|
- High correlation between pairs of predictor
variables.
- Regression coefficients whose signs or magnitudes do not make
good physical sense.
- Statistically nonsignificant regression coefficients on important
predictors.
- Extreme sensitivity of sign or magnitude of
regression coefficients to insertion or deletion of a predictor.
|
|
|
| The diagonal values in the (X'X)-1
matrix called Variance Inflation
Factors (VIFs) and they are very useful measures of multicolinearity.
If any VIF exceed 5, multicolinearity is a problem. |
|
|
| |
|
|
| Model Selection |
|
|
| A frequent problem in data mining is to
avoid predictors that do not contribute significantly to model prediction.
First, It has been shown that dropping
predictors that have insignificant coefficients can reduce the average error of predictions.
Second, estimation of regression coefficients are likely to be unstable due to multicollinearity
in models with many variables. Finally, a simpler model is a better model
with more insight into the influence of predictors in models. There
are two main methods of model selection: |
|
|
- Forward selection, the best predictors are
entered in the model, one by one.
- Backward Elimination, the
worst predictors are eliminated from the model, one by one.
|
|
|
| |
|
|
|
|
|
|
| |
|
|
|
|
|
