| Map > Data
Science > Explaining the Past
> Data Exploration >
Bivariate
Analysis > Categorical & Numerical |
|
|
|
|
|
|
Bivariate Analysis
- Categorical & Numerical
|
|
|
|
|
|
Line Chart with Error Bars
|
|
|
|
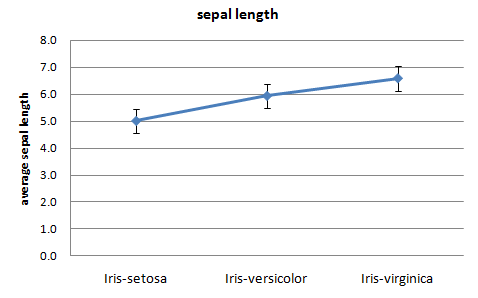
A line chart with error bars displays information as a series of data points connected by straight line segments.
Each data point is average of the numerical data for the corresponding
category of the categorical variable with error bar showing standard error. It is a way to summarize how pieces of information are related and how they vary depending on one
another (iris_linechart.xlsx).
|
|
|
|
|
|
|
|
|
|
|
|
|
|
|
Combination Chart
|
|
|
|
A combination chart uses two or more chart types to emphasize that the chart contains different kinds of information.
Here, we use a bar chart to show the distribution of a binned numerical
variable and a line chart to show the percentage of the selected category
from the categorical variable. The combination chart is the best
visualization method to demonstrate the predictability power of a predictor
(X-axis) against a target (Y-axis).
|
|
|
|
|
|
|
|
|
|
|
|
|
|
|
Z-test and t-test
|
|
|
|
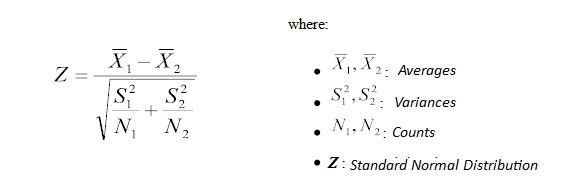
Z-test and t-test are basically the same. They assess whether the averages of two groups are statistically different from each other. This analysis is appropriate
for comparing the averages of a numerical variable for two categories of a
categorical variable.
|
|
|
|
|
|
|
|
If the probability of Z is small, the difference between
two averages is more significant.
|
|
|
|
|
|
|
|
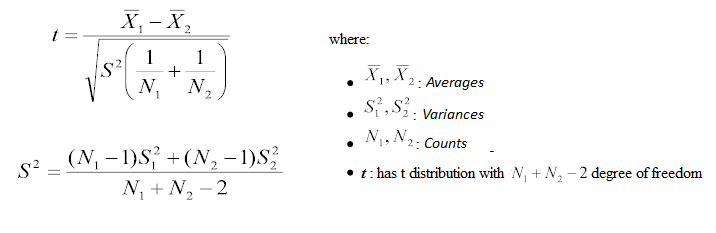
t-test
|
|
|
|
When the
n1
or
n2
is less than 30 we use the t-test instead of the Z-test.
|
|
|
|
|
|
|
|
Example:
|
|
|
|
Is there a significant difference between the means
(averages) of the numerical variable (Temperature) in two different categories of the
categorical variable (O-Ring Failure)?
|
|
|
|
|
|
|
| O-Ring
Failure |
Temperature |
|
Y
|
53 |
56 |
57 |
70 |
70 |
70 |
75 |
|
|
|
|
|
|
|
|
|
|
|
N
|
63 |
66 |
67 |
67 |
67 |
68 |
69 |
70 |
72 |
73 |
75 |
76 |
76 |
78 |
79 |
80 |
81 |
|
|
|
|
|
|
|
|
t-test |
O-Ring Failure
|
| Temperature |
Y |
N |
| Count |
7 |
17 |
| Mean |
64.43 |
72.18 |
| Variance |
76.95 |
30.78 |
| t |
-2.62 |
|
| df |
22 |
|
| Probability |
0.0156 |
|
|
|
|
|
|
|
|
|
The low probability (0.0156) means that the difference
between the average temperature for failed O-Ring and the average temperature
for intact O-Ring is significant.
|
|
|
|
|
|
|
|
|
|
|
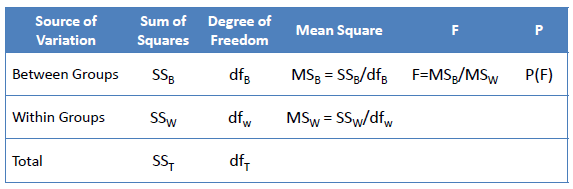
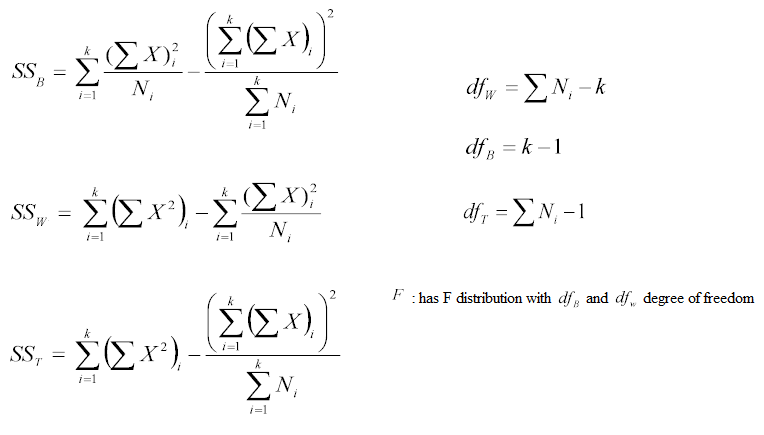
Analysis of Variance (ANOVA)
|
|
|
|
The ANOVA test assesses whether the averages of more than two groups are statistically different from each other. This analysis is appropriate
for comparing the averages of a numerical variable for more than two categories
of a categorical variable.
|
|
|
|
|
|
|
|
|
|
|
|
Example:
|
|
|
|
Is there a significant difference
between the averages of the numerical variable (Humidity) in the three
categories of the categorical variable (Outlook)?
|
|
|
|
|
|
|
| Outlook |
Humidity |
| overcast |
86 |
65 |
90 |
75 |
|
| rainy |
96 |
80 |
70 |
80 |
91 |
| sunny |
85 |
90 |
95 |
70 |
70 |
|
|
|
|
|
|
|
| Outlook |
Count |
Mean |
Variance |
| overcast |
4 |
79.0 |
127.3 |
| rainy |
5 |
83.4 |
104.8 |
| sunny |
5 |
82.0 |
132.5 |
|
|
|
|
|
|
|
| Source
of Variation |
Sum of Squares
|
Degree of freedom
|
Mean Square
|
F Value
|
Probability
|
| Between
Groups |
44.0 |
2 |
22.0 |
0.182 |
0.836 |
| Within
Groups |
1331.2 |
11 |
121.0 |
|
|
| Total |
1375.2 |
13 |
|
|
|
|
|
|
|
|
|
|
|
There is no significant difference between the averages
of Humidity in the three categories of Outlook.
|
|
|
|
|
|
|
|
|
|
|
|
|
|
|
