Model Evaluation - Regression
Relative Squared Error
| Map > Problem Definition > Data Preparation > Data Exploration > Modeling > Evaluation > Deployment | ||
Model Evaluation - Regression |
||
| After building a number of different regression models, there is a wealth of criteria by which they can be evaluated and compared. | ||
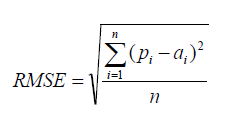
| Root Mean Squared Error | ||
| RMSE is a popular formula to measure the error rate of a regression model. However, it can only be compared between models whose errors are measured in the same units. | ||
|
|
||
|
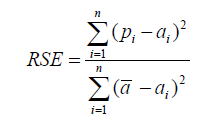
Relative Squared Error |
||
| Unlike RMSE, the relative squared error (RSE) can be compared between models whose errors are measured in the different units. | ||
|
|
||
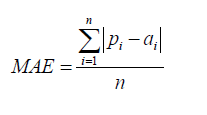
| Mean Absolute Error | ||
| The mean absolute error (MAE) has the same unit as the original data, and it can only be compared between models whose errors are measured in the same units. It is usually similar in magnitude to RMSE, but slightly smaller. | ||
|
|
||
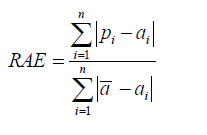
| Relative Absolute Error | ||
| Like RSE , the relative absolute error (RAE) can be compared between models whose errors are measured in the different units. | ||
|
|
||
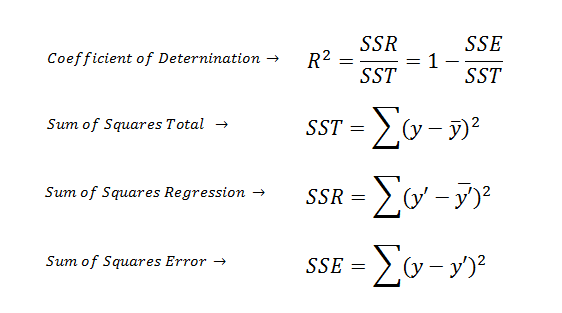
| Coefficient of Determination | ||
| The coefficient of determination (R2) summarizes the explanatory power of the regression model and is computed from the sums-of-squares terms. | ||
|
|
||
| R2 describes the proportion of variance of the dependent variable explained by the regression model. If the regression model is “perfect”, SSE is zero, and R2 is 1. If the regression model is a total failure, SSE is equal to SST, no variance is explained by regression, and R2 is zero. | ||
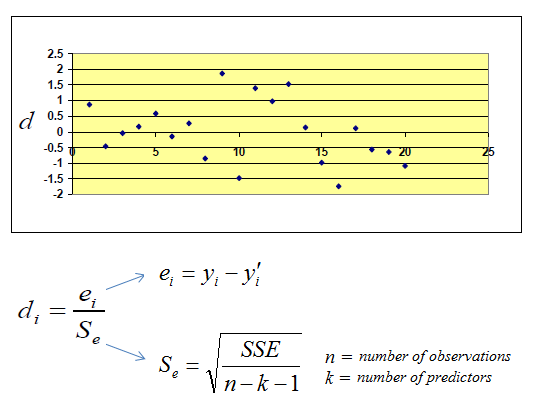
| Standardized Residuals (Errors) Plot | ||
| The standardized residual plot is a useful visualization tool in order to show the residual dispersion patterns on a standardized scale. There are no substantial differences between the pattern for a standardized residual plot and the pattern in the regular residual plot. The only difference is the standardized scale on the y-axis which allows us to easily detect potential outliers. | ||
|
|
||